
During this first market analysis for the year 2025, it will be an opportunity to analyze the usual charts, but over large time units. The objective is to have a sufficiently broad vision of the major objectives on cryptocurrencies, the key supports and resistances and the bias to be had during the coming weeks.
The cryptocurrency market, on the way to a capitalization of 8,000 billion dollars?
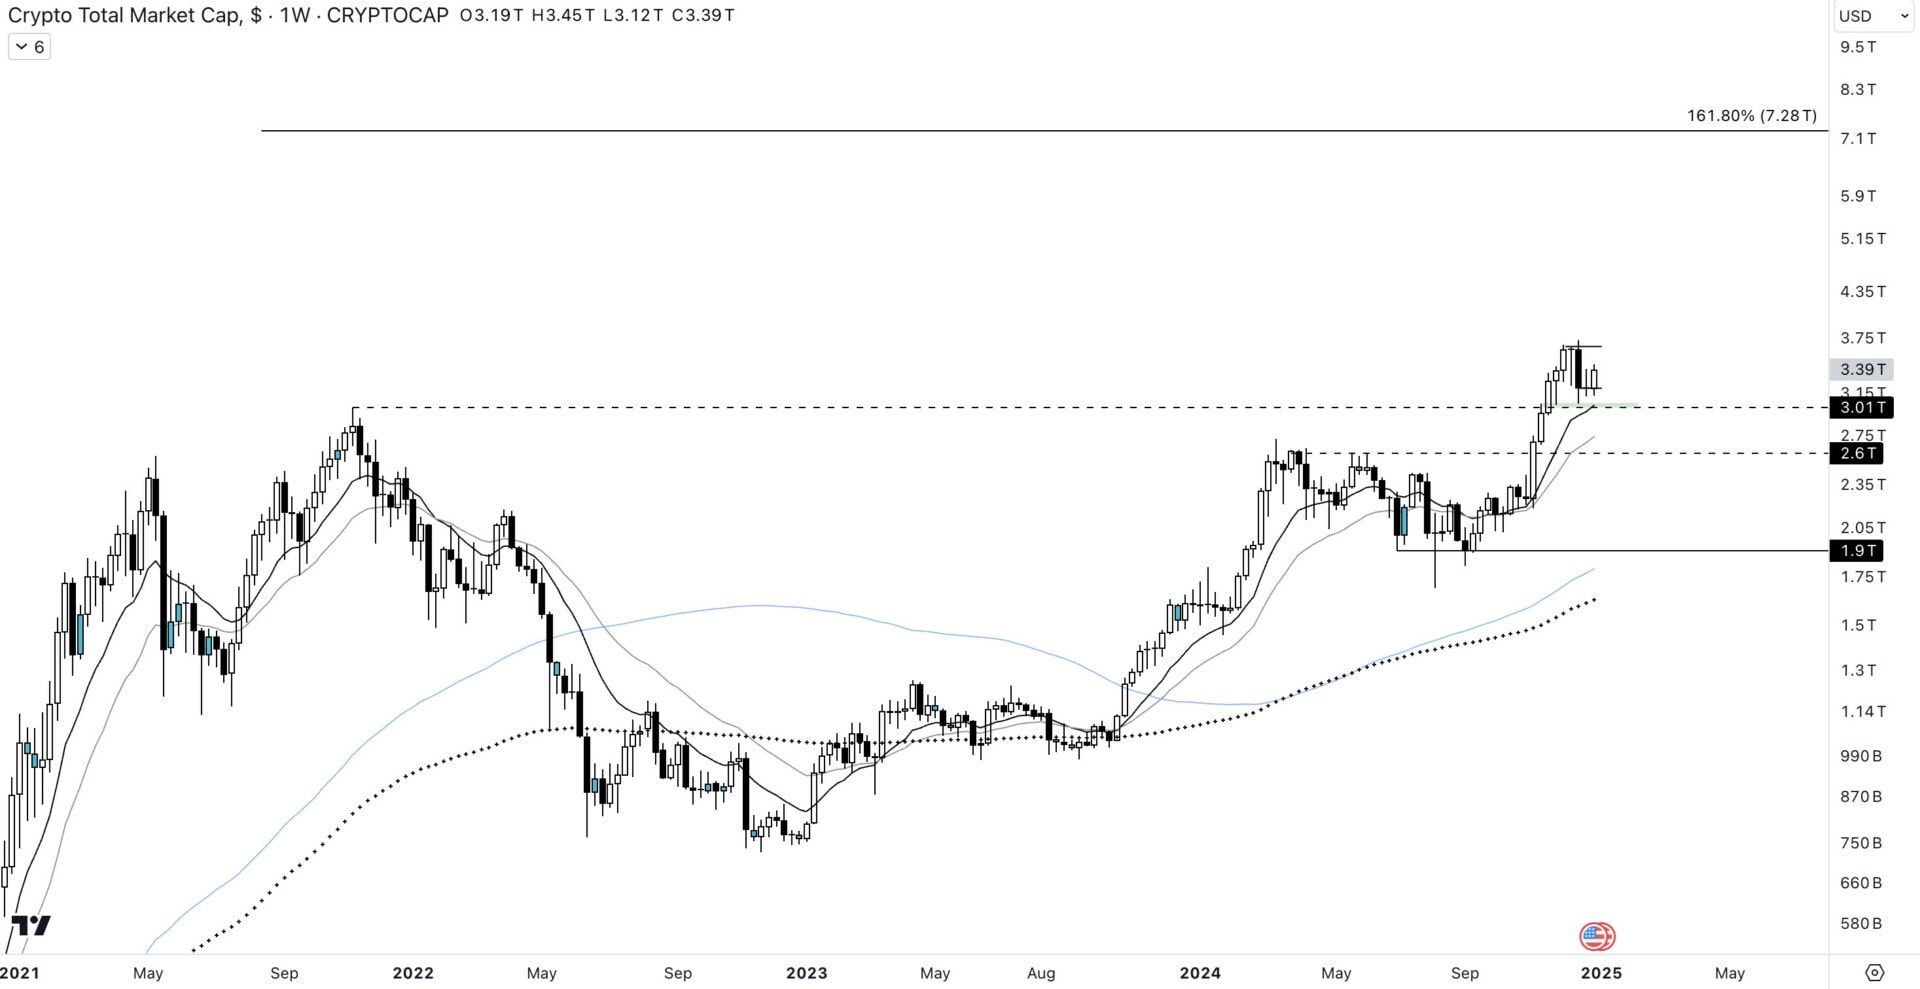 Price of the total market capitalization against the dollar on the 1W time unit On the total market capitalization, the passage having taken place above the 3 trillion dollars at the end of the year 2024 marks the start of a first stage in the bullish trend what the market will experience in 2025. Maintaining above this old resistance zone, the price seems to be taking a break. In a way, with low volatility of the market, this demonstrates a more wait-and-see position on the market in recent days. However, with the recovery of the markets following the end-of-year holidays and the imminent inauguration of Trump, it is a safe bet that these coming weeks will see a return to significant volatility. With a medium-term objective, located around the 7.2 trillion dollarsthe bullish outlook and room for maneuver for buyers is significant. The bias is clearly bullish on the total market capitalization (ascending troughs and peaks) and will thus continue as long as the market preserves the $3 trillion zone.
Altcoins haven't started the altseason yet?
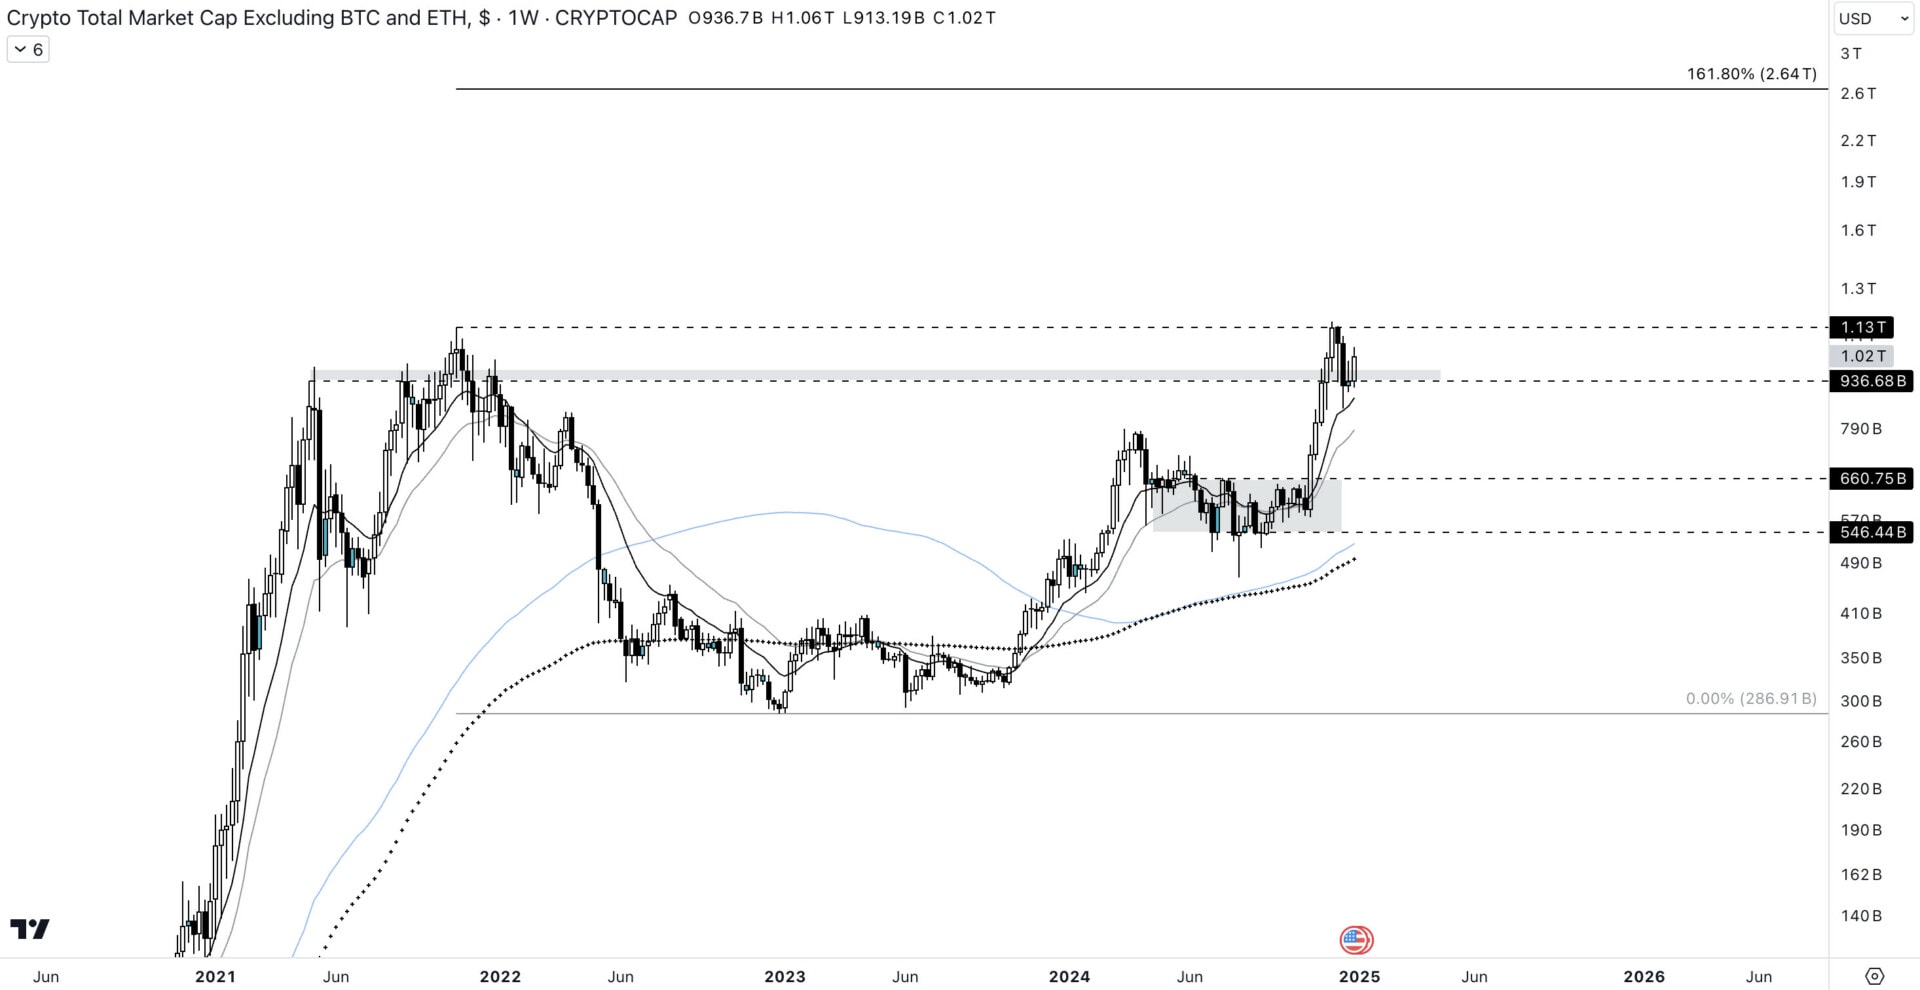 Price of the capitalization of altcoins, excluding bitcoin and ethereum, on the 1W time unit On the altcoin side, we note that the dynamics are identical to last week. Indeed, the price manages to preserve the technical zone around 940 billion dollars. The current ATH is still in the $1.13 trillion area (ATH of 2021). This consolidation under a resistance zone while preserving support is a configuration which has a strong chance of leading to a upward explosion. The bias is also bullish over this unit of time, the difference in the evolution of this graph with the total market capitalization lies in the increase having taken place for the king of cryptocurrencies. Altcoins still have beautiful months ahead of them. If bitcoin does not fall in 2025, altcoins have every chance of heading towards $2.6 trillion. Regardless, it will be appropriate for this asset class to remain above $1,000 billion and the 13/25 EMA cluster. As long as the price remains above, altcoins will always have high chance of taking off. However, if the price loses this old resistance zone, the price could head in the direction of 660 billion of dollars. The graph will therefore need to be followed with particular attention to understand the direction that the market will take and the capacity that altcoins will demonstrate to do well.
The dominance of bitcoin in a complex in-between
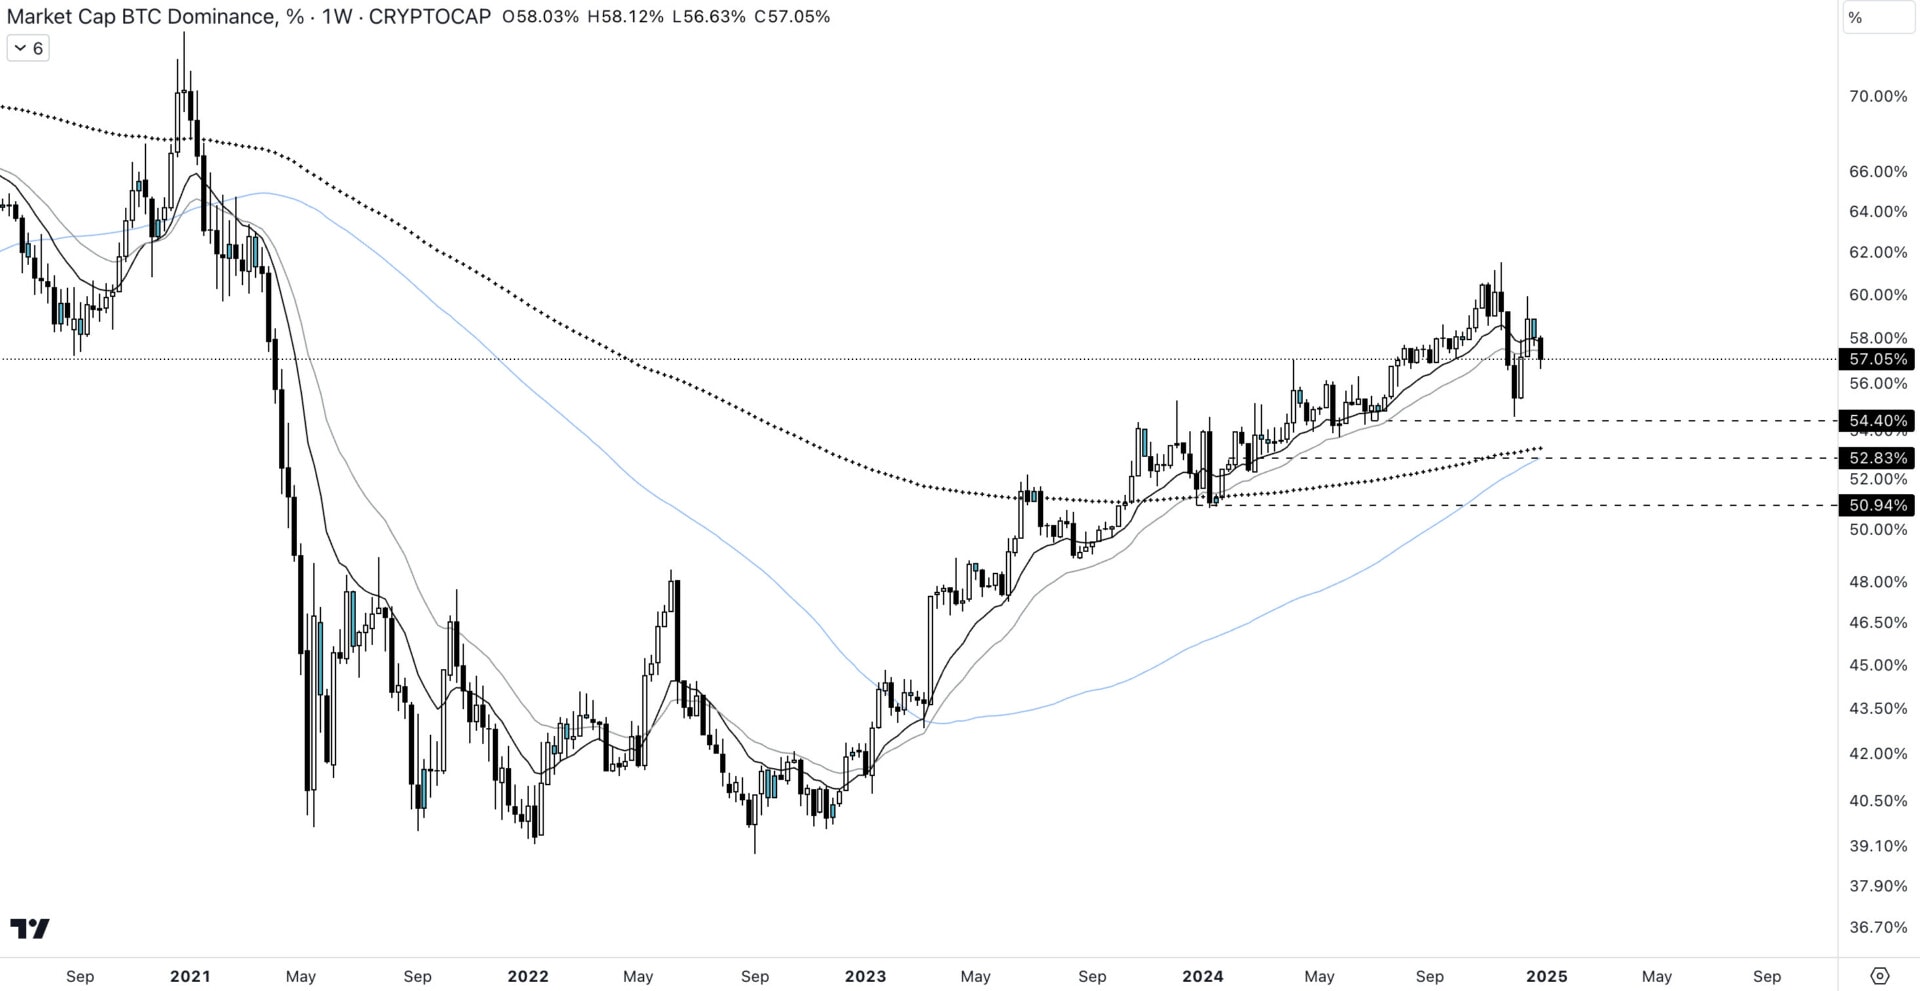 Price of the dominance of the king of cryptocurrencies on the 1W time unit Altcoins being in a good position, this is rather contradictory with the current situation of the dominance of the king of cryptocurrencies, always finding itself in high price zones. Oscillating for a long time around 60% dominance, the price however turns out to be difficulty on the EMA 13 & 25 cluster, which raises the question of bitcoin's ability to attract capital in the coming months. If the market starts the year on the rise, for altcoins to benefit from a favorable context, it will be necessary to see changes in the price of BTC.D. Ideally, a return below 54.40% will be a first step towards a long-term downward trend reversal in bitcoin's dominance. Let us note that in 2021, the price took a few months before registering a strong bullish leg, increasing the dominance of bitcoin from almost 70% to less than 40%. Will we experience the same scenario with an expansion of the altcoin sector in the coming months? For this to take shape, the price will have to fall below the cluster of the 200 EMA and the 100 MA around the 52 % of dominance.
2025, the return of Ethereum to the forefront?
 Price of the ETH/BTC pair on the 1M time unit Concerning the ETH/BTC pair, there are few elements to discuss since last week. On the monthly view, the observation is rather clear: ethereum continues to underperform. However, we have been facing a lateralization of the pair for four months. Are we in the scenario of the end of 2019 before a new bullish leg? Or, are we simply experiencing a decline in volatility before regaining new ascending lows very soon? The configuration of the ETH/BTC pair is not at all favorable to a strong recovery of the asset. Nevertheless, we should hope for a strong recovery of Ethereum so that it can, in turn, free yourself from the ATH against the dollar. In this context, let's watch for a candle that could swallow the few months of lateralization and cross the 0.04 BTC zone. Until there is a strong market reaction on the matter, there will not be much to expect from the ETH/BTC pair. Despite these uncertainties, the presence of a certain selling force on BTC.D and a sharp drop in volatility on the price of ETH/BTC however opens the door to a buyer dynamics for the next few weeks. Let's keep in mind that altcoins are in a very favorable position upwards, as well as the total capitalization of the market. Apart from a downward catalyst, there is no reason to see a market reversal and sellers gaining strength.